


- Community
- Arts, Culture and Heritage
- Citizenship Ceremonies
- Community Associations and Groups
- Community Connect
- Community Funding
- Community Research
- Community Stories
- Community Wellbeing
- Economic Development
- Emergency Management
- Energy Saving Tips
- Event Planning and Venues
- Manaaki
- Managing the risk of wildfire
- Māori Community
- Newcomers Guide
- Population and Demand
- Summerdaze
- Tuia Programme
- Welcoming Communities
- Venue Hire
Population and Growth
Whakatupuraka o te Taupori
Queenstown Lakes District is a high growth district within New Zealand. To help address this key challenge and assist with future planning, we have developed comprehensive demand projections. Demand projections provide a guide to the possible future population of the district and are used along with other tools to assist short-term and long-term planning needs.
Quick links
Demand Projections
QLDC produces the following types of projections:
-
Resident population
-
Number of visitors (on both an average and peak day)
-
Number of dwellings that will be required in the future
-
Rating units
These are projected out for a 30-year period for each of the district’s communities.
Disclaimer: These population projections have been prepared by council officers with assistance from Utility Limited. The information contained in the population projections document is intended for general guidance only and does not contain or convey legal advice. The information herein should not be used or relied on without first consulting professional advice.
The below dashboard provides an easy-to-understand summary of the QLDC demand projections. Population, housing, and rating unit data can be found on separate tabs, along with a table containing the full data. A PDF summary is available for download below the dashboard.
Frequently asked questions
-
Demand projections include forecasts of resident population, visitor numbers, houses, and rating units. These are forecast out 30 years for all Queenstown Lakes District communities.
These forecasts include several sub-categories including average and peak day visitation, resident homes and holiday homes, and various rating unit categories. Peak day visitation assumes all Queenstown Lakes district communities have their peak day simultaneously and in practice is only likely on very few days over the Christmas/New Year period. Visitor numbers are projected alongside resident numbers to give a true sense of the demand on the district’s infrastructure, and providing a peak day forecast ensures that infrastructure demands are met year round.
Demand projections are forecasts of future demand on resources and infrastructure based solely on data available at the point in time the projections are calculated. They are not goals or targets, or developed with any particular policy outcomes in mind, but simply outline potential growth in line with current and historical data and are used to assist short-term and long-term planning needs. Unforeseen events such as natural disaster, pandemics, or the effects of changes in government legislation are not incorporated into the calculation of the projections.
-
Demand projections are produced under guidance from Utility Limited. The underlying method is summarised below and further detail can be found in the methodology document.
-
Predict the future resident population – this is made up of assumptions on natural change and net migration. The ongoing trend of people wanting to come and live in the Queenstown Lakes district is expected to continue. The marked increase in migration from elsewhere in New Zealand and the world was modelled using a combination of Stats NZ data and bespoke assumptions.
-
Calculate the number of houses required to house the future population, including an allowance for a trend towards smaller households; aging population, reduction in birth rates.
-
Add the growth in holiday houses used to accommodate visitors.
-
Visitor numbers based on a long-term extrapolation of historical growth and 5-year international visitor projections from MBIE. These have been validated with alternative data sources including legacy DataVentures cell phone data and other similar studies of the district’s tourism market. The ratio of visitors to residents and peak day to average day visitors are based on this historical data.
-
Project the number of rating units based on the rate of growth in the applicable growth variable above.
-
-
A variety of different inputs are used to determine the growth in each of the projections over the 30 year time period. These include population and household data from Stats NZ, visitor data from Ministry of Business, Innovation and Employment, QLDC consents and rating units data, historic ratios, and research on short-term accommodation.
-
Visitor forecasts include both an average day and peak day forecast. Average day visitors are calculated by dividing the annual forecast for total visitor guest nights (or guest days) by 365. Peak day visitors are calculated using historic ratios of peak to average day visitors. Peak day visitation assumes all Queenstown Lakes district communities have their peak day simultaneously and in practice is only likely on very few days over the Christmas/New Year period.
Accurate forecasting of visitor demand is difficult due to the wide range of influences on tourist numbers. The visitor projections should be interpreted as providing an indication of the possible future visitor population should historical patterns and a specific set of assumptions be met in the future.
-
Projections are not forecasts or predictions of future populations. These projections are one tool for understanding possible future growth in the QLDC region and to inform long term planning. They are calculations of what will happen if specific assumptions are met in the future. The projections provide information on plausible scenarios about future populations, not predictions of what the population will be, to help inform decision making.
Many other social and economic factors, that are not part of population projections, also influence population change, including central and local government policies, global economics, changing lifestyle factors and social norms and expectations. The relationships between these various factors are complex and difficult to predict far into the future. As a result of this complexity, the reliability of projections tends to decrease over time and as population size decreases, that is, there is greater uncertainty in population projections the further forward in the projection period and for smaller area units compared to the district as a whole.
-
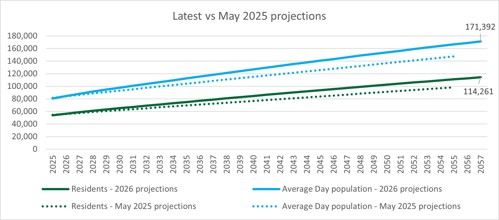
The latest projections show resident numbers increasing to 110,983 in 2055 and an average day population of 166,475. This compares to the 2025 projections of 98,345 and 147,518 by 2055 respectively. This equates to a 13% increase in population than previously projected.
-
The projections are utilised across Council in many workstreams, which includes:
-
The Queenstown Lakes Spatial Plan
-
Long Term Plan and Annual Plan
-
30 Year Infrastructure Strategy
-
District Plan
-
Development Contribution Policy
-
Business cases
-
Masterplans
-
Strategies / Policies
-
Housing and Business Capacity Assessments
-
-
The projections are reviewed on a regular basis and updated when required.
Further information
A document produced by Utility Limited outlining the methodology and inputs used to produce the latest demand projections can be accessed below, along with the previous projections produced in 2025. For any further information please contact: